Water Use Dataviz
Date
November 2023
Category
Motion & Data vizualisation
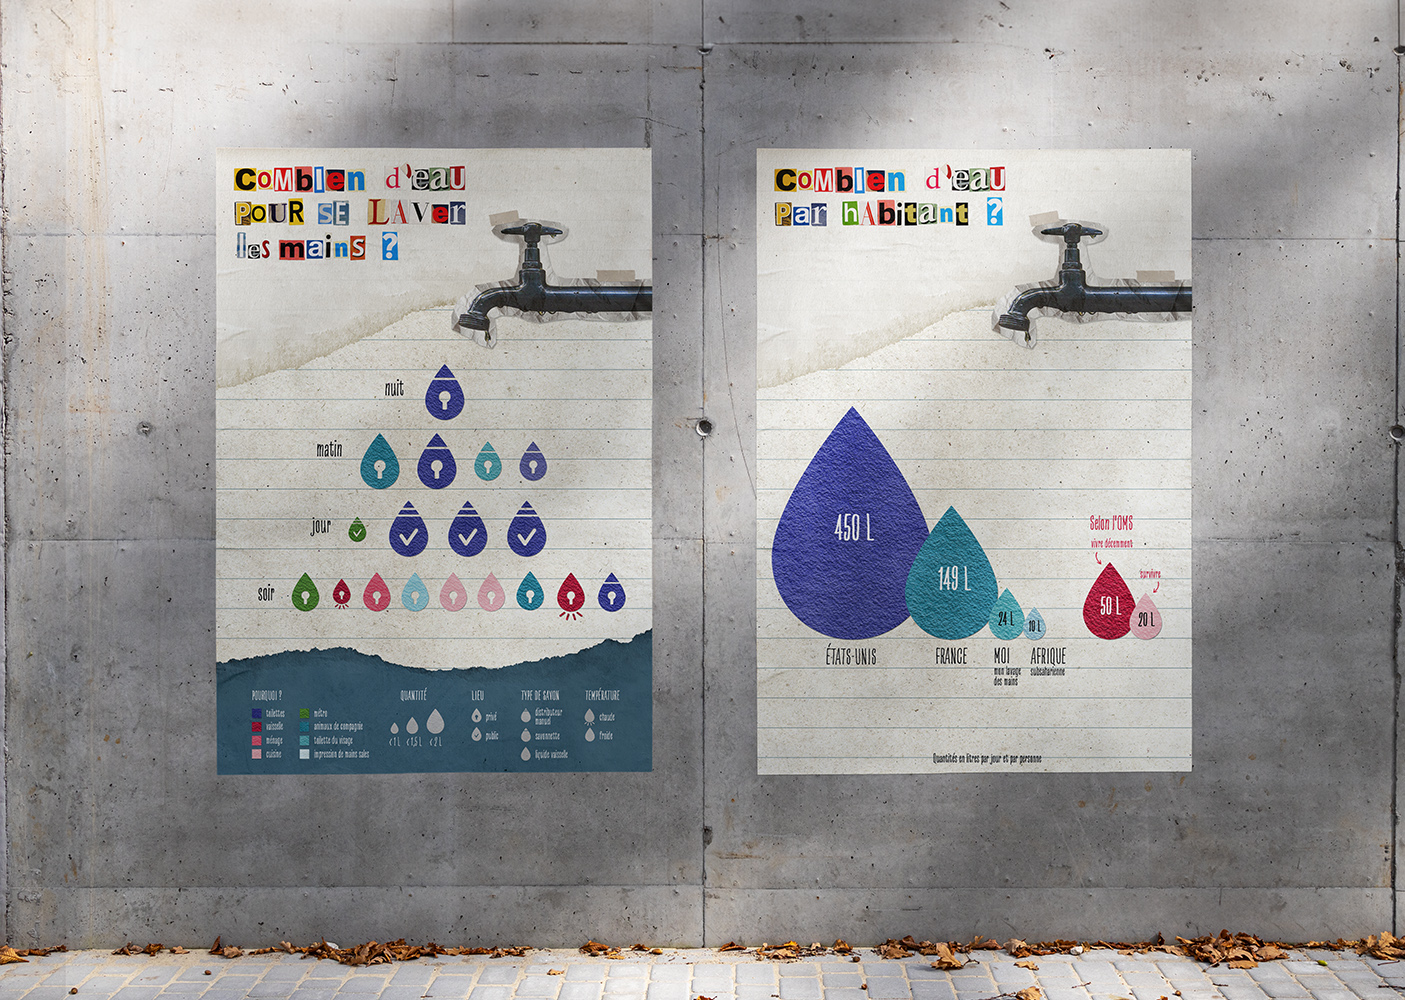
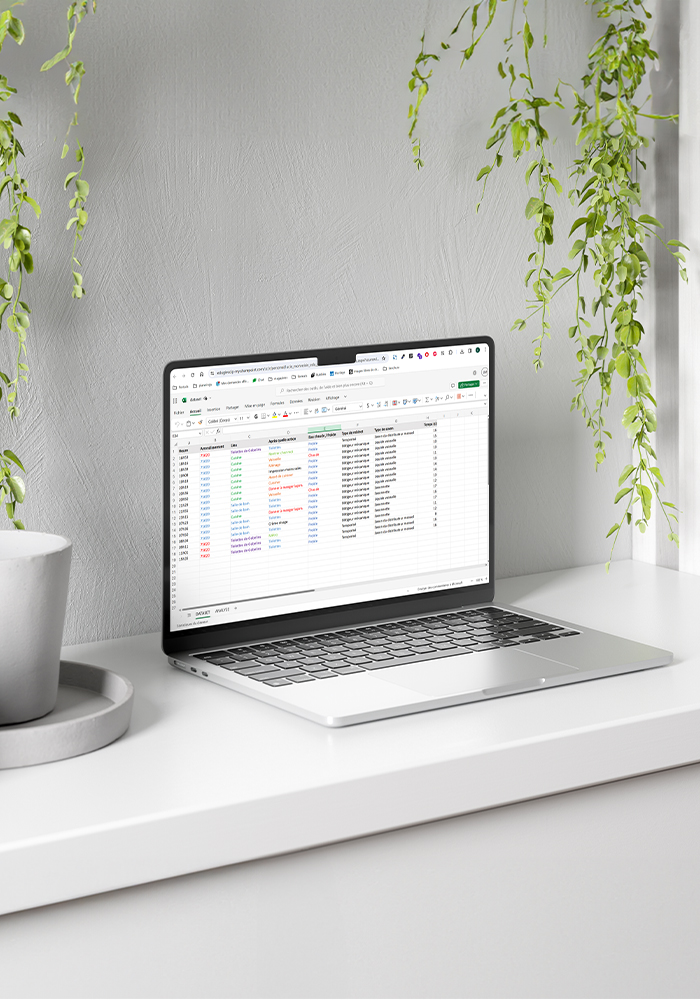
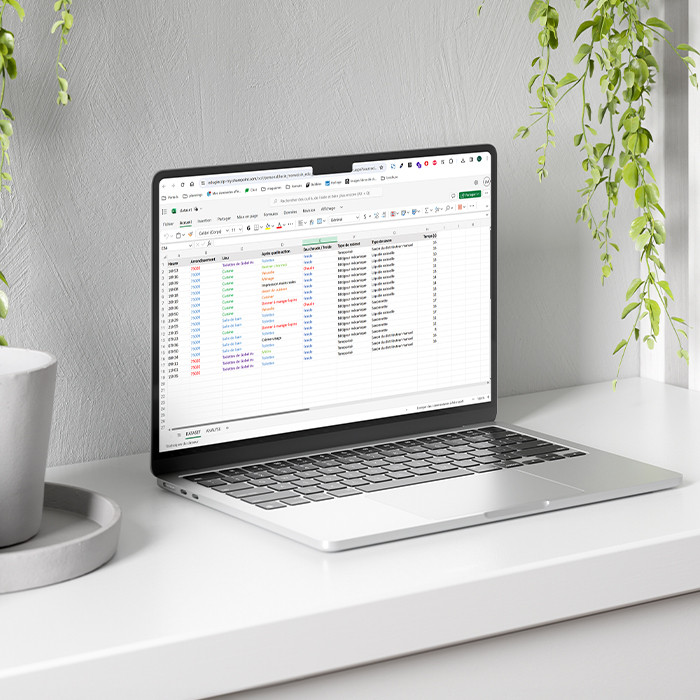
This data visualization focuses on my use of water to wash my hands throughout a day. First, I collected the data. For 24 hours, I listed every time I washed my hands (time of day, location, reason, type of tap, duration...). Then, I classified and analyzed the data and calculated the amount of water used for each wash. And, I compared my data with those available on daily water usage per capita in certain countries.
For the visualization, I drew inspiration from the Dear Data project by Giorgia Lupi and Stefanie Posavec. I selected attentive attributes based on colors and shapes. Finally, I created a motion design of my data visualization.